
Explore the performance results of QuantAlgoLab algorithmic trading strategies developed through quantitative research, optimization, and historical backtesting.
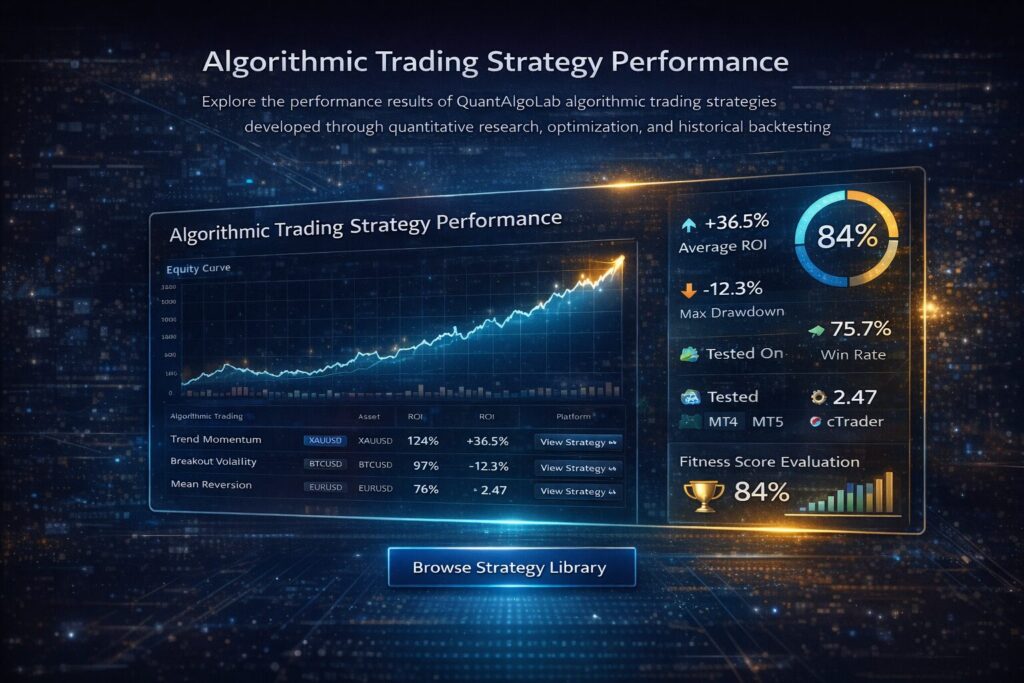
Optimized strategies target strong risk-adjusted returns through systematic trading rules.
Strategies are evaluated to maintain controlled drawdown levels..
Strategies are tested using extensive historical market data.
Strategies are tested using extensive historical market data.
| Evaluation Metric | Description |
|---|---|
| Return on Investment (ROI) | Measures total profitability of the strategy during historical testing |
| Maximum Drawdown | Evaluates the largest peak-to-trough decline |
| Win Rate | Percentage of profitable trades |
| Profit Factor | Ratio of total profits vs total losses |
| Trade Frequency | Average number of trades per period |
| Fitness Score | Composite ranking score used to evaluate strategy quality |
Backtesting is used to evaluate how algorithmic trading strategies perform under historical market conditions. The illustration below demonstrates how strategy performance is analyzed through equity curve tracking, drawdown monitoring, and trade distribution analysis.
Backtesting results are based on historical data simulations and are provided for research and educational purposes only. Past performance does not guarantee future results.
Equity curve visualization tracks how a trading strategy's capital evolves over time during historical backtesting.
Trade distribution metrics evaluate win rate, profit factor, and overall strategy efficiency.
Drawdown analysis identifies periods of capital decline and helps evaluate the risk profile of a trading strategy.
Algorithmic trading strategies designed to deliver steady performance while maintaining disciplined risk management and controlled drawdown levels.
Professionally engineered algorithmic trading systems optimized through quantitative analysis to enhance performance potential and trading efficiency.
Institutional-grade quantitative trading systems ranked through rigorous fitness score analysis and risk-adjusted return evaluation.
Browse the QuantAlgoLab strategy library to review available algorithmic trading systems and their quantitative research background.
Backtesting results are hypothetical and based on historical data analysis. Past performance does not guarantee future results.
Algorithmic trading strategy performance refers to how a trading system performs when tested using historical market data. Key metrics include equity curve growth, maximum drawdown, trade distribution, and overall risk-adjusted returns.
They often show:
stronger risk-adjusted returns
lower relative drawdown levels
stable performance across multiple instruments
Strategy performance is evaluated using backtesting analysis, optimization metrics, and quantitative performance indicators such as drawdown, win rate, and risk-adjusted return.
No. Backtesting results are based on historical data simulations and do not guarantee future performance. Strategy evaluation is intended to analyze behavior under past market conditions.